A Framework for Engineering Agentic Value


We may have lost the plot.
In early 2025, a wave of "AI mandates" emerged. Tech leaders shifted from encouraging experimentation to making AI proficiency a non-negotiable job requirement. Shopify’s CEO Tobi Lütke’s internal memo became a benchmark for "AI-first" corporate cultures. In a $12 billion modernization initiative, Citigroup’s CEO Jane Fraser mandated the use of generative AI for coding and data cleansing across their 30,000 developers, stating that being proactive was "an essential part of winning in the digital era". Management at Salesforce followed a comparable path, asserting that staff who cannot integrate AI into their workflows are falling behind their peers. In April 2025, Satya Nadella, CEO of Microsoft, revealed that 30% of the company's code is AI-generated. This milestone signaled a "magic target" that was embraced by the tech industry in its dual form: (1) establishing AI-driven development as a productivity benchmark and (2) opening the door to potential reductions in engineering staff.
As of early 2026, the tech industry has evolved from broad "AI mandates" towards granular tracking of AI token consumption as a proxy for productivity. This trend, referred to as "tokenmaxxing," marks a shift where leadership treats token usage as a measure for how "AI-native" an employee is. As an example, internal reports at Meta revealed a company-wide leaderboard (dubbed "Claudeonomics") that ranked over 85,000 employees by their token burn. High-usage developers could earn titles like "Token Legend" or "Session Immortal". Similarly, KPMG introduced an internal dashboard to track how often employees use artificial intelligence tools. The company set a 75% usage target for many staff members, aiming to accelerate adoption across its US advisory business.
The convergence of engineering and corporate politics has unlocked a unique brand of workplace pressure: token consumption as a primary proxy for employee engagement.
However, with companies like Zapier monitoring individual employee AI token consumption via a dedicated dashboard to manage automation costs, we’re now in a different scenario than a year ago. High token usage can be a double-edged sword. In an attempt to distinguish between innovative "golden patterns" and wasteful "anti-patterns", employees using 5 to 10 times more tokens than their peers could be flagged for review.
I will briefly digress to address the elephant in the room: the cost per token.
Whether token costs increase or decrease is, in a sense, irrelevant to whether we need a systematic approach to engineering AI value. Please note that I didn’t say it’s irrelevant for the actual practice of AI value engineering; rather, tying this framework/methodology adoption to token costs trends is flawed. Here’s why:
The Token-costs-will-go-down Camp
In 1865, economist William Stanley Jevons observed that as steam engines became more fuel-efficient, Britain's total coal consumption went up. Cheaper energy per unit of work meant people used more energy overall.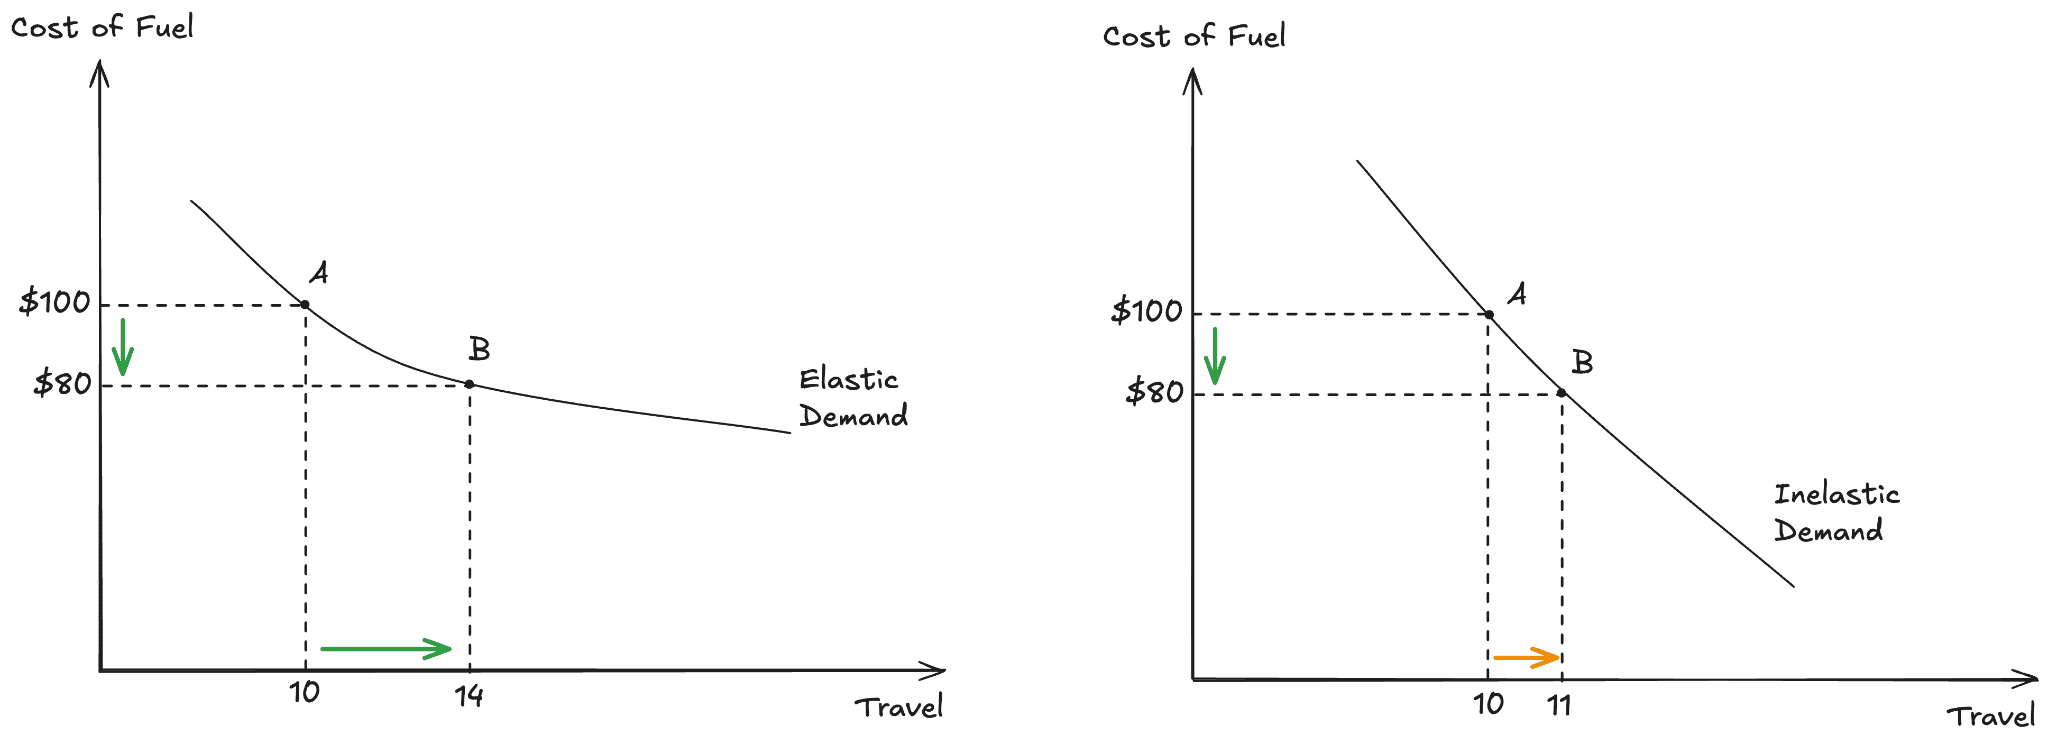
Because the same thing happened with cloud computing, the assumption is that we’ll have a per-token price race to the floor. However, that holds only if volume scales faster than the price drops, meaning we’re operating under the elastic demand scenario. Even if that happens, the paradox predicts that the total spending will go up as lower cost per token leads to more use-cases becoming viable, which means increased usage and increased token consumption.
Arguing that per-token cost will inevitably decline requires accepting either the implications of the Jevons paradox or that the paradox can be broken by inelastic demand: if value does not increase significantly, consumption may not rise even if tokens become free. One could posit that this outcome is undesirable, unless we are intentionally preparing for a "token-apocalypse" event, a scenario that would likely prove dire for many.
In reality, demand highly depends on the use case. For instance, in inelastic scenarios such as compliance document review, actual legal compliance volumes don't grow even with lower costs. Conversely, elastic use-cases like agentic coding loops see demand surge as cheaper tokens enable deeper search and longer planning chains.
Thus, both demand scenarios require engineering AI value attention, albeit manifested in different ways: (1) in the first case because as the total token consumption grows, AI workloads need optimizations to keep healthy business margins; (2) in the second case because the demand doesn’t increase, the cost savings are implicit and while that’s a good outcome short term, it might force a major rethinking of the entire line of AI offerings.
The Token-costs-will-go-up Camp
This camp got a validation boost from the recent moves announced by Anthropic:
changing enterprise pricing from flat-rate subscriptions to usage-based billing
requiring external tools to use either a pay-as-you-go API key or separate "Extra Usage" bundles, effectively ending the "all-you-can-eat" buffet for third-party apps, while
Claude Opus 4.7 maintains the same sticker price as its predecessors (Opus 4.5 and 4.6), but it is widely considered significantly more expensive because of a "stealth" change in its tokenizer (1,000 words that cost 1,300 tokens in Opus 4.6 might now cost 1,750 tokens in 4.7).
The main counterargument to the token price going down is physics. Training a frontier model is a one-time event, but the inference happens billions of times a day, forever. As AI becomes ubiquitous, with agents running 24/7 and every app calling an LLM, the energy cost of serving tokens dominates the cost of creating the model. Sadly, the cost curves of electricity generation are far more stubborn because they’re tied to natural resources, which are being depleted. Recent analysis found that US data centers could consume 9% to 17% of total US electricity generation by 2030, which is more than double the current levels.
Until nuclear capacity arrives, the marginal token is priced off natural gas peakers, which are themselves under pressure. That’s why some hyper-scalers are signing power purchase agreements at $80–$110/MWh on long-dated contracts, well above historical industrial rates. This cost flows directly into the marginal cost of a token.
So, for the time being, it would seem that even with heavily subsidized consumption, the underlying costs (energy, capital, capex) required to produce a token are rising, underscoring (once more) the need for a more disciplined approach to value creation rather than a wait-and-see strategy.
These inconsistent policy shifts reveal a myopic perspective on AI adoption. They point to a more profound and uncomfortable issue buried deep beneath the surface: AI value realization is failing to meet expectations and, when it finally does, it’s fundamentally asymmetrical. This is supported by reports showing that:
despite $30–40 billion in enterprise investment into GenAI, 95% of organizations are getting zero return
over 40% of AI agents might be canceled by the end of 2027 due to escalating costs or unclear business value
88% of observed PoCs don’t make the cut to wide-scale deployment.
In my view, this signals an urgent plea for help. The current frantic race to implement AI, no matter the consequences, often masks a more fundamental requirement: a specialized area of research & development supported by a robust framework to ensure its continuity. To successfully steer through the intricate challenges of this volatile AI environment, we must adopt a practice I call "engineering AI value".
In the traditional B2B SaaS world, value engineering is typically handled by the sales department. AI-centric organizations must reimagine and elevate this function into a foundational R&D pillar.
This requires a structured approach that grounds modern AI challenges in timeless engineering principles. Rather than inventing a new field entirely, I’m (re)surfacing the foundational concepts of Value Analysis and Engineering, pioneered by Lawrence D. Miles. The following section introduces The Framework for Engineering Agentic Value, which I adapted from these 65-year-old techniques to serve the unique complexities of agentic systems.
The Framework for Engineering Agentic Value
In 1961, Lawrence D. Miles of General Electric wrote the definitive book on Techniques of Value Analysis and Engineering. Miles’s concepts and techniques are centered on functions that the customer needs and wants. Because of that, they’re remarkably applicable even to AI systems today:
The market success of a product or service relies heavily on its ability to maintain:
Leadership or equality in performance
Leadership or equality in cost relative to competitors at any time
Improving value involves focusing on two distinct areas of opportunity:
Pinpointing costs that are redundant/unnecessary
Executing decisions to remove those identified costs
Value analysis aims to ensure that identifying and eliminating unnecessary costs is as effective as discovering and implementing performance enhancements.
At this point, we need to introduce a definition of value and stick with it at least until the end of this article - and hopefully beyond. According to Miles, “a product or service is considered having good value if that product or service has appropriate performance and cost. More precisely: (1) value is always increased by decreasing costs (while, of course, maintaining performance); (2) value is increased by increasing performance, if the customer needs, wants, and will pay for more performance.”
Let’s unpack.
The first thing to notice is that, under the terms of this definition, the best value is determined by two considerations that cannot be decoupled: performance and cost. This might sound counterintuitive for an early-stage AI startup team because, for them, bringing the product into existence takes precedence over costs, especially if they’re VC-funded. The goal during the research and development stage is to put the MVP (Minimum Viable Product) in front of customers as soon as possible and sell it in sufficient numbers to, ideally, support further improvements. Miles refers to this as performance-oriented work because it’s centered on using resources to serve customers with a new product.
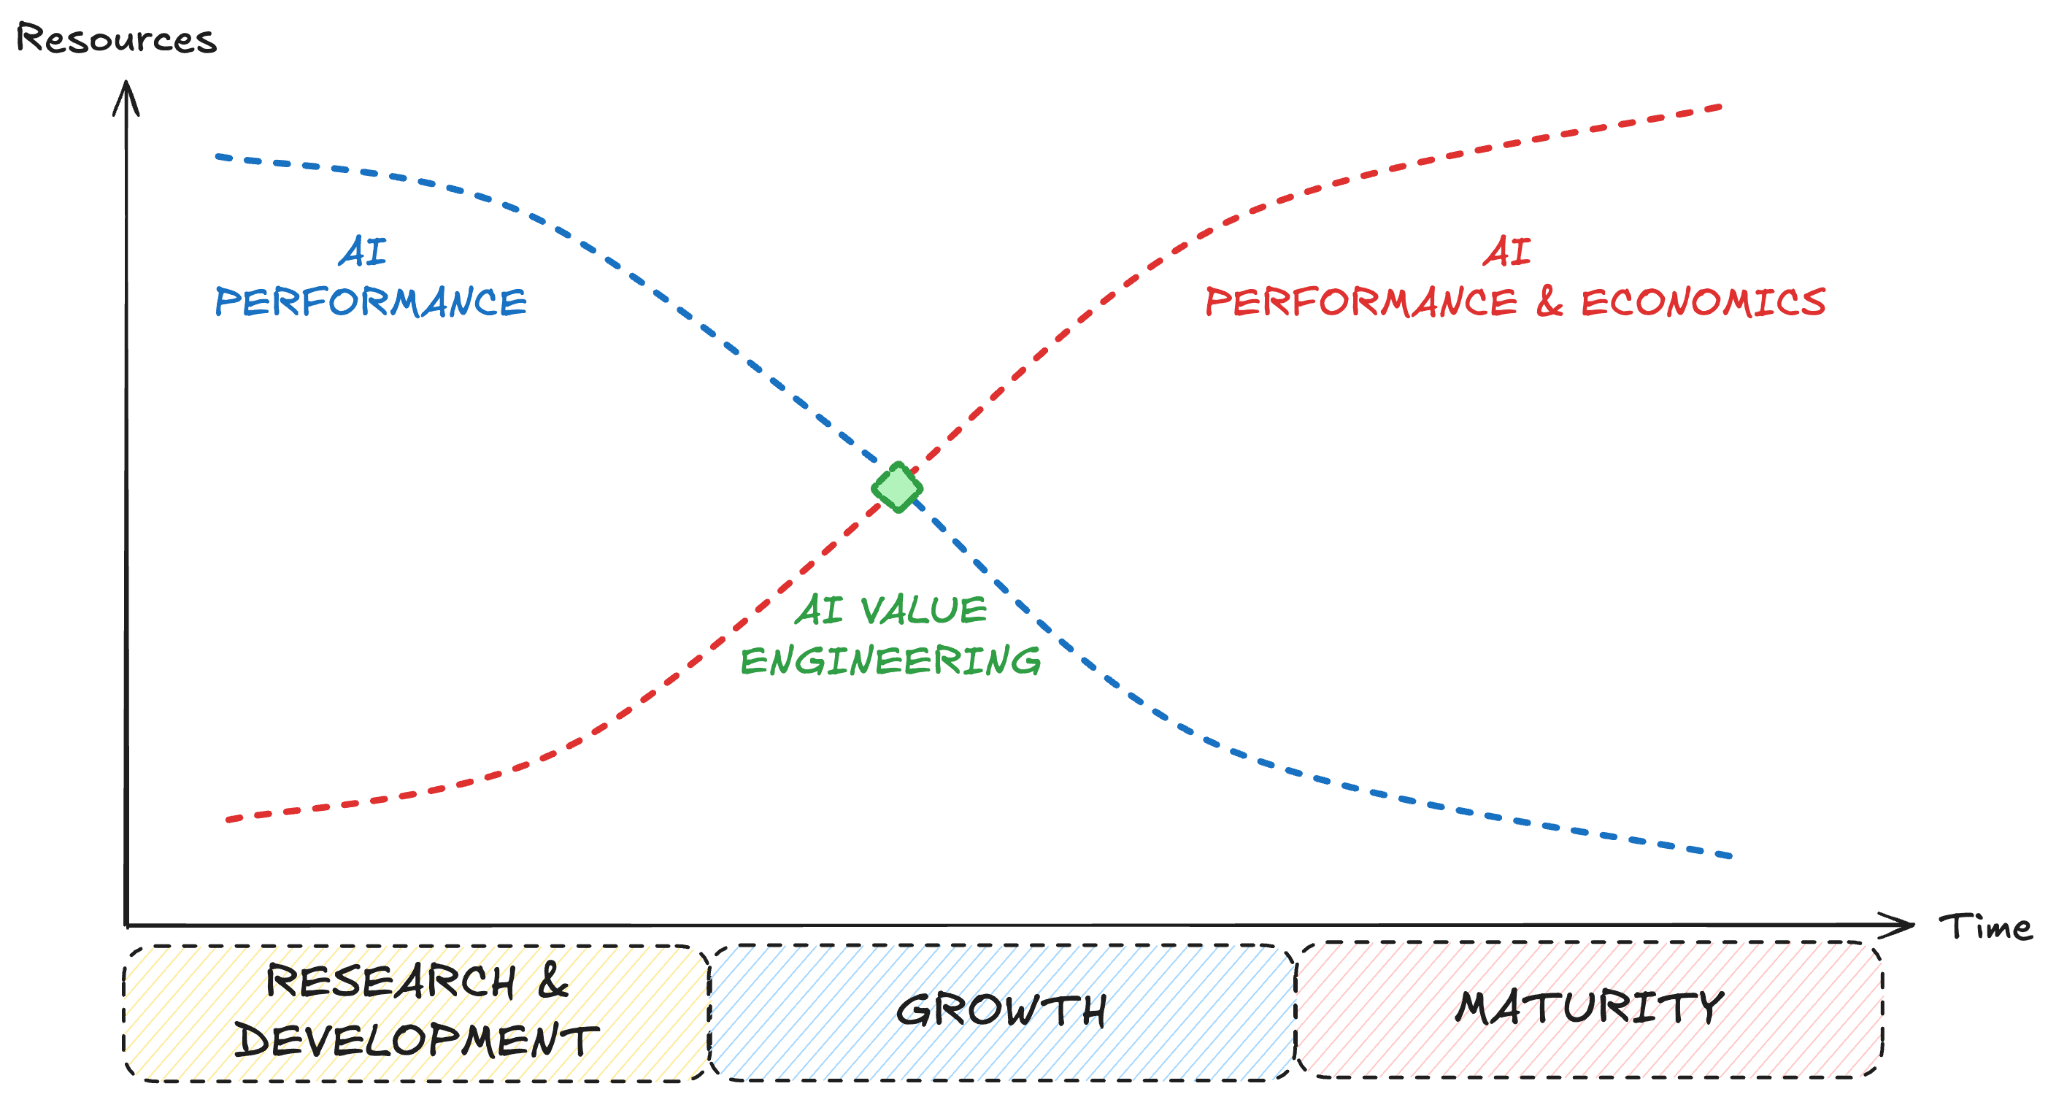
It is only at the growth/scale phase that we see an inflection point. Having proved that the product fills a need and gains customer demand while competitors are entering the field, teams think in terms of value-work: improving their product, both from a performance and economic point of view. Of course, there’s a tradeoff between the two; it might not make sense to invest in improving the performance of your model from 95 to 99% (whatever the metric), but do so from 80 to 90%.
Finally, during the maturity stage, it is expected that new efficiency contributions are marginal. Being able to assure performance equality and value leadership becomes critical, even if that means that the effort is very much elevated compared to the other stages.
The Agentic Value Engineering Framework is represented as a meta dual-loop (detailed below): observe-orient-decide-act (OODA) loop and the observe-stabilize-standardize-optimize (OSSO) loop. This framework is designed for systems that have reached at least the MVP stage, and provides a structured methodology for enhancing the core pillars of agentic value: performance (P) and costs (C). Instead of addressing the initial AI workflow development process, these loops focus on refining and advancing existing agentic systems that are operational in production.
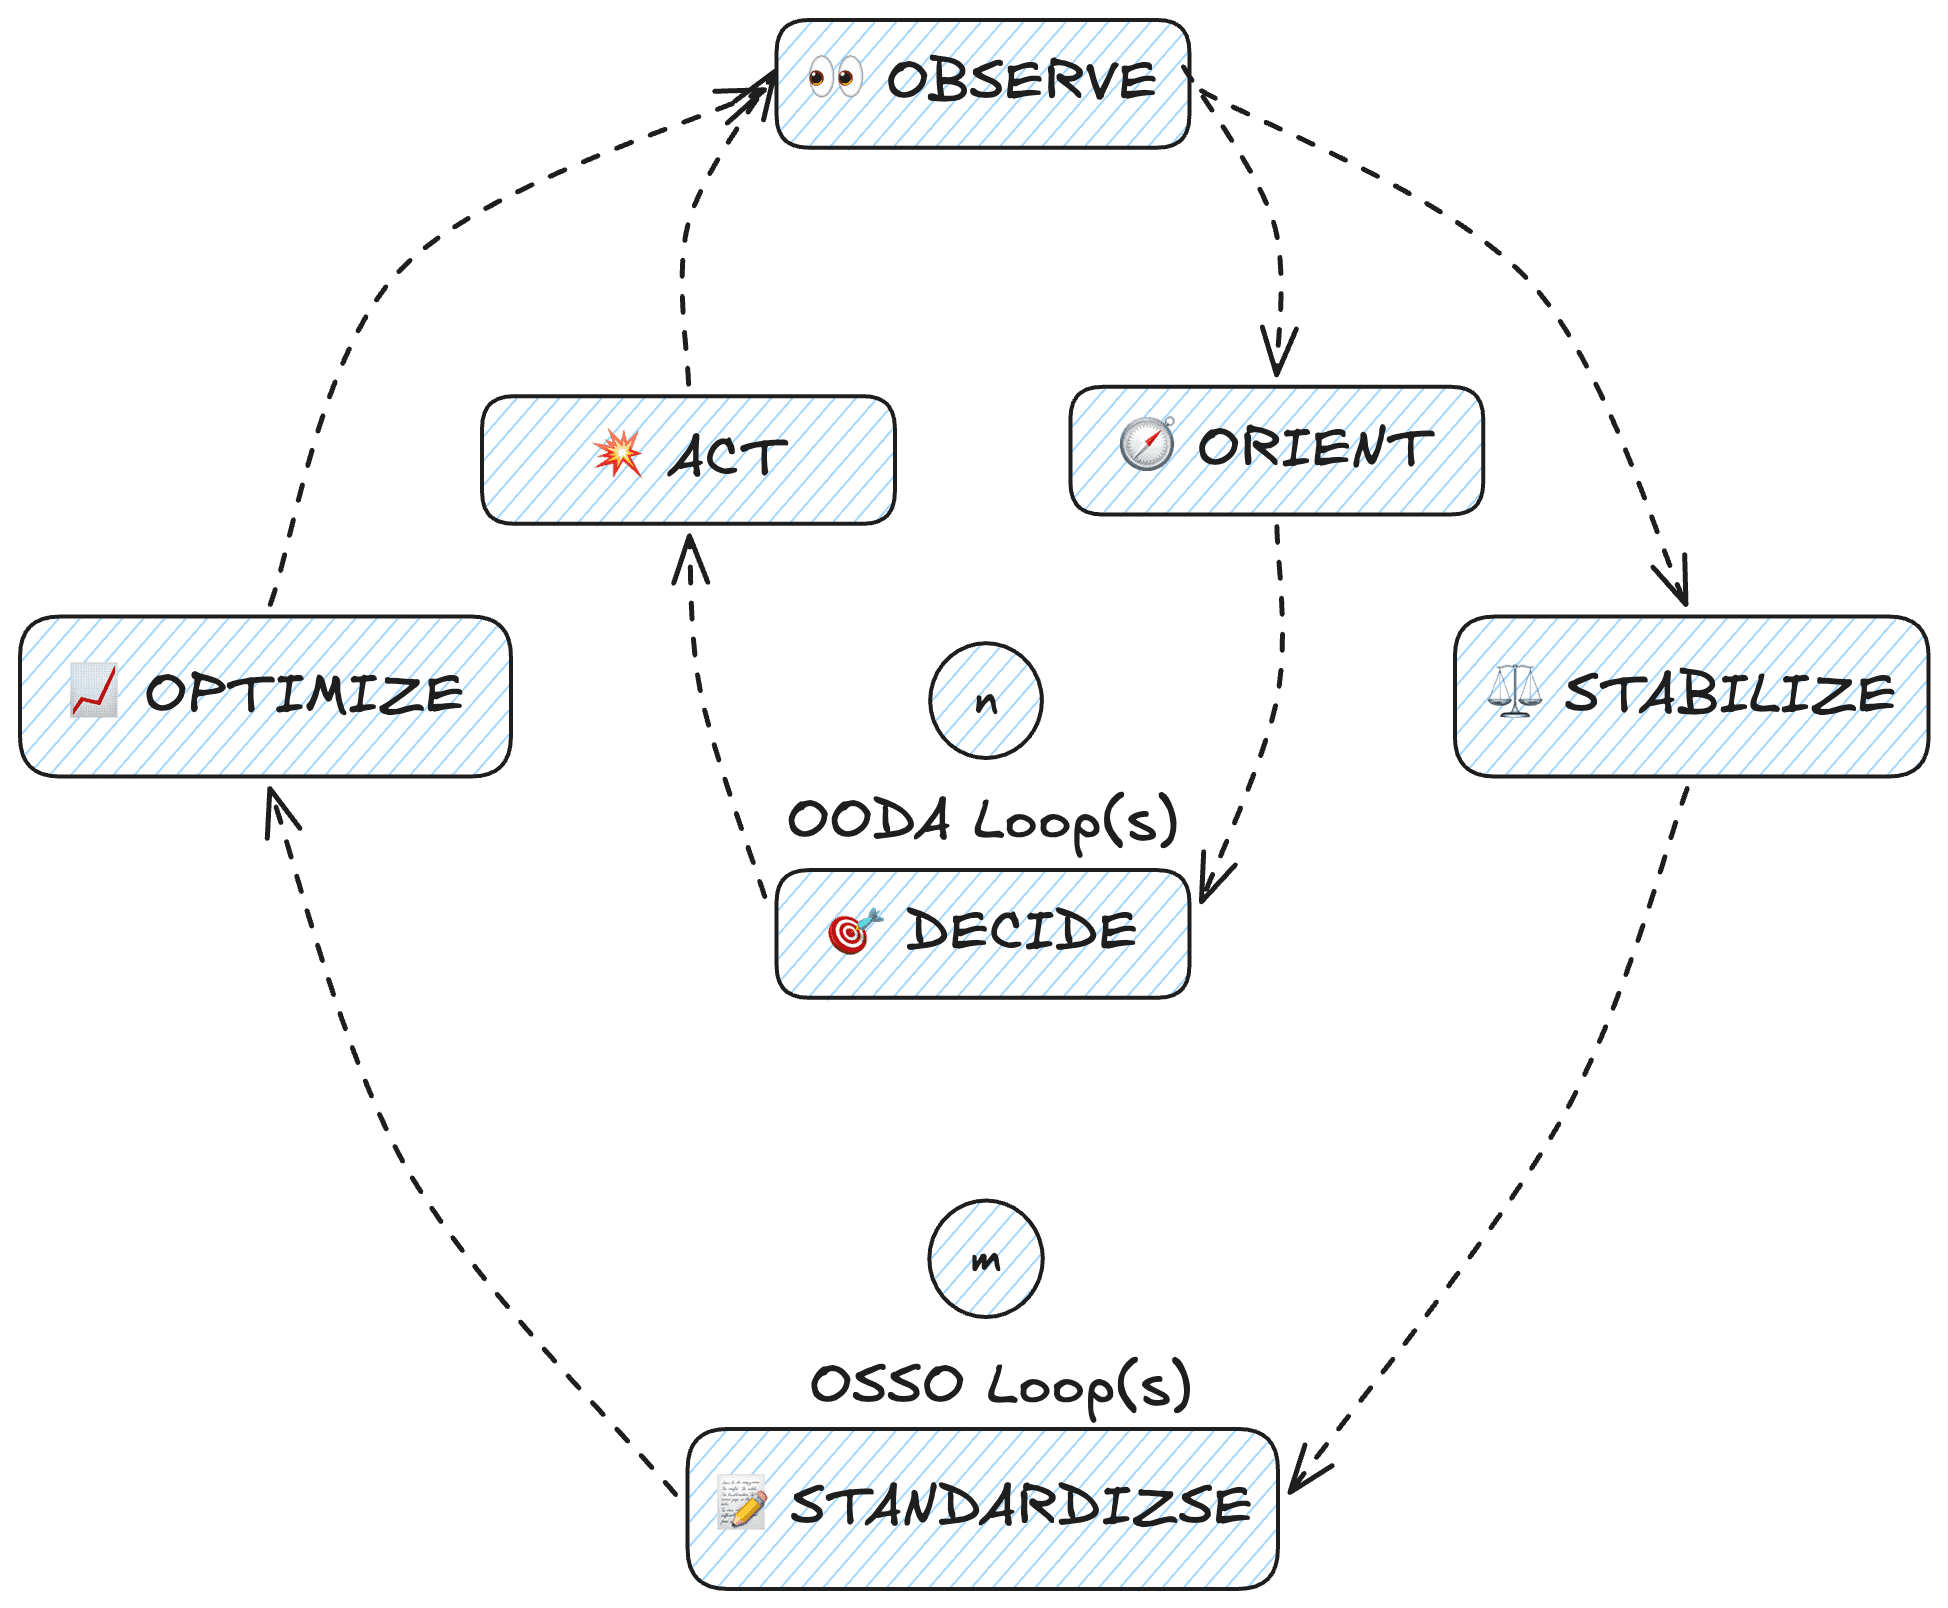
This meta dual-loop structure is intentional. It aims to ensure that our proficiency in pinpointing and eliminating redundant costs matches our capability to identify and integrate performance enhancements for a product or service. The core purpose of this methodology is to achieve a level of precision in cost reduction that is on par with the systematic advancement of product or service functionality.
It is represented as a meta dual-loop because: (1) the objective of the first loop (OODA) is to analyse and improve the performance of our agentic system; (2) the objective of the second loop (OSSO) is to optimize its unit economics while incorporating the performance improvements identified in the first loop. As shown in the diagram, we encourage rapid iteration across both stages. The OODA loop typically operates at a higher frequency and speed than the OSSO loop (n > m).
Let’s dive in.
The Observe - Orient - Decide - Act (OODA) Loop for AI Systems
If you’ve never heard of it, the OODA loop, developed by the late US Air Force Colonel John R. Boyd, is a strategic framework originally derived from military and fighter-pilot tactics, widely used to improve competitive power in business, sports, and other high-stakes environments.
While Boyd’s actual diagram of the OODA loop is more complex, featuring continuous, interacting processes with multiple feedback and feed-forward mechanisms, the abstraction I’m presenting here is meant as a simplification of the concept - a high-level cycle that we can iterate through as many times as needed.
Given its military origins, the OODA loop was designed for individuals modeling real-world conflict as a way of adapting to the unfolding situation more rapidly than the opponent can comprehend, forcing them to constantly re-evaluate reality, which generates uncertainty, confusion, panic, and debilitating paralysis, ultimately leading to their collapse.
While we must adapt the OODA loop for our own objectives, it is vital to avoid treating the AI system as an adversary or viewing our engagement with it as a zero-sum game. In war, surprise produces shock and exploitation, but in digital products, surprise produces either delight or “I'm never using this again” reactions. This is the conflict that we must resolve.
In the context of agentic AI, if we interpret the business model as the "opponent" within Boyd's strategic framework, our analysis must prioritize a profound grasp of customer value drivers. By aligning our focus this way, we can anticipate user expectations more effectively. This proactive stance allows us to forecast with greater precision which autonomous behaviors will be celebrated as successes and which will be dismissed as failures.
Observe
In the data collection phase, we need to address two questions: what is the agent doing, and what are users getting from it?
For an agentic system, Observe goes beyond instrumentation, including two streams that have to flow continuously and be time-stamped against each other, so they can be correlated downstream:
Telemetry data from the agent: traces of every tool call with arguments and results, the sequence and timing of reasoning steps, retrieval queries and what came back, model confidence signals where available, latency at each hop, token consumption, retry patterns, error and exception events, fallback activations, guardrail triggers, and the structure of multi-step plans the agent constructs and revises mid-execution.
User-side interaction analytics: tracks session starts, query evolution, re-prompting, corrections, abandonment, and output editing. This can include downstream behaviors like retention, delegation patterns, and output sharing. Implicit signals such as dwell time, scroll patterns, and linguistic register (frustration or trust) can also help segment users into cohorts to identify growth areas or unused features. While individual signals are limited, their joint distribution captures the true interaction value.
Together, these streams form the Observe phase. They have to be collected with enough fidelity, granularity, and temporal alignment so that downstream orientation can correlate across them. For example, a usage anomaly should be traceable to the underlying telemetry.
Orient
Orientation is where the streams from Observe get converted into a working understanding of the agentic system, the users, and the gap between intended and actual value. The substrate that makes this possible is best understood as a context graph.
While a knowledge graph holds entities and the stable relationships between them, a context graph holds all of that plus the decision traces: the moments where the agent gathered inputs, evaluated policies, considered alternatives, invoked exceptions, and committed to actions, along with the why-links that explain how each decision drew on prior precedent.
The shift is from a structure that tells you what exists to a structure that tells you why each thing happened the way it did. An agentic system is well-positioned to produce this kind of graph because, in Bessemer's framing, it is a system of action: it sits in the execution path and does the work, which means decision traces fall out of it as a byproduct of operation, rather than having to be reconstructed afterward from logs or warehouse snapshots. In this framing, each observation record we sketched earlier is already a decision trace in raw form.
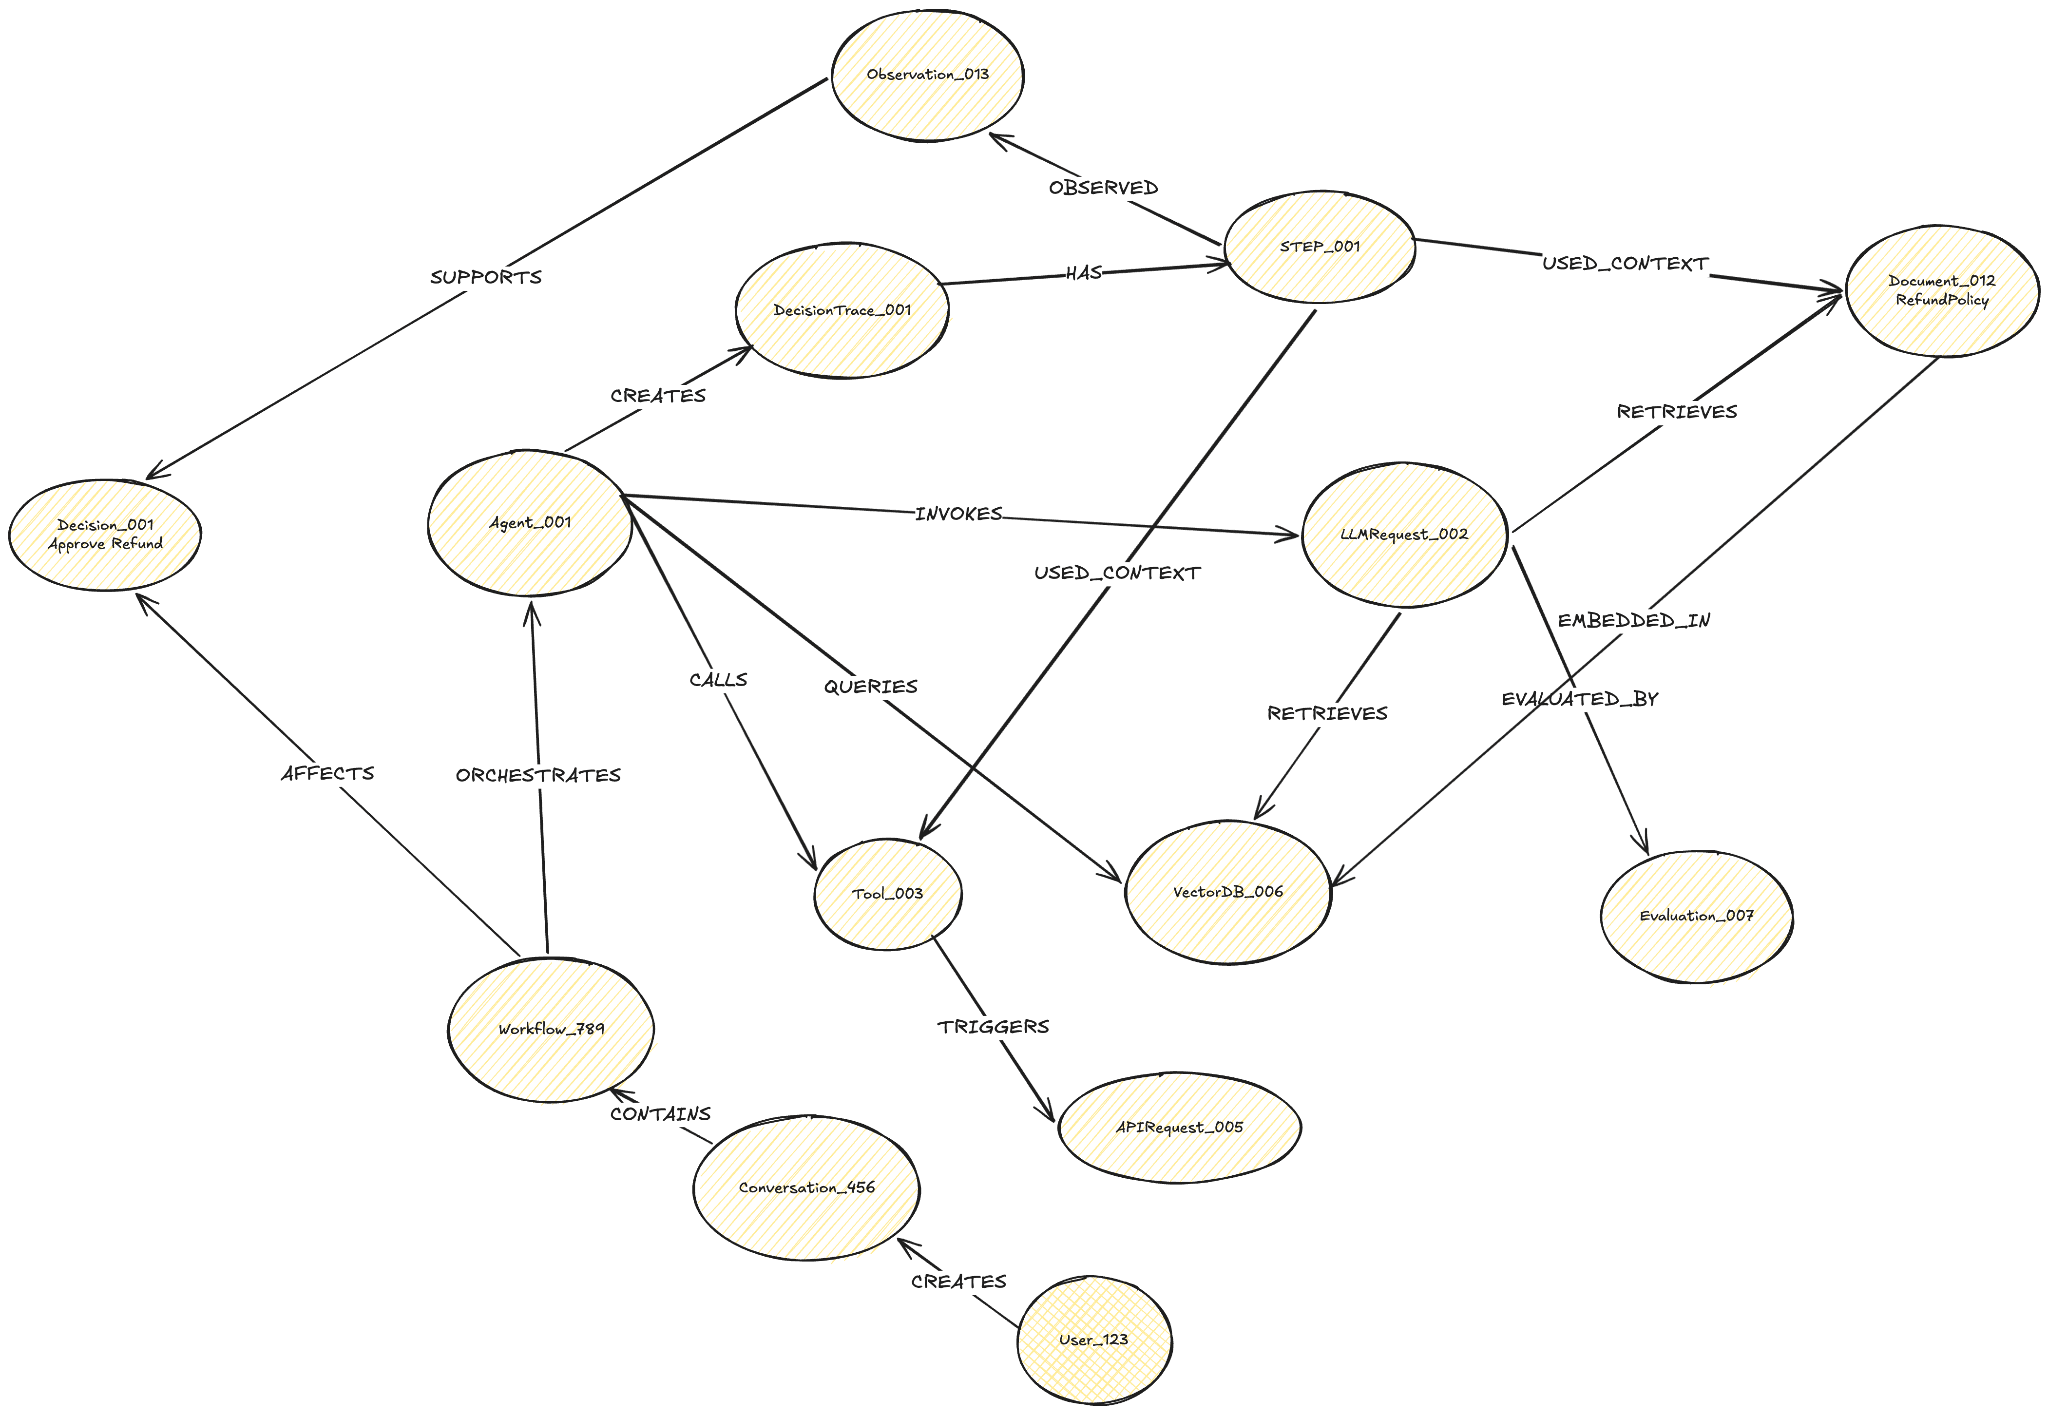
Orient's first job is to ingest these per-session traces into the context graph in a form that preserves their decision-time integrity, so that any prior decision can be replayed in the context that produced it rather than rationalized from its outcome. This phase is predictive and precedent-grounded in nature. For example, it should be able to tell that an agentic system handled cases matching a certain signature 847 times, surface the distribution of actions it took, and the distribution of value outcomes that followed.
Mismatch detection becomes a comparison against precedent: when the agent handles a familiar task class differently, that divergence is itself a signal worth surfacing, before any outcome data has arrived to confirm whether the change was for better or worse. The value model accumulates as outcome signals attach to decision traces over time, which means it stops being a team intuition and becomes a queryable corpus of which decision patterns correlate with which value outcomes for which user cohorts under which conditions.
While each AI system might be different, one could imagine that context graphs could be used to improve some of the following performance-oriented metrics:
Latency | p50/p95/p99 response latency, context retrieval latency, tool-call latency, model inference latency, time to first token, time to last token |
Throughput | requests/sec, tokens/sec, jobs/minute, context lookups/sec, successful completions/minute, concurrent sessions |
Error Rate | request failure rate, timeout rate, retrieval failure rate, tool-call failure rate, invalid response rate, unsupported answer rate, rollback rate |
Saturation | CPU/memory/GPU utilization, queue depth, worker pool saturation, DB connection saturation, API quota saturation, graph/vector store saturation |
Decide
Decide is the smallest step in the loop when Orient is doing its job. Most of the performance work has already happened upstream, which means Decide is selecting from options whose likely consequences are already understood rather than reasoning from scratch under pressure. Mind that this step refers specifically to the team's commitment to modify the agent for performance optimization, rather than the autonomous choices made by the agent itself.: ship a new version, adjust a guardrail, retrain on a corrected dataset, deprecate a tool, expand or restrict a capability, route a task class differently. The context graph supports the OODA framing because it's the loop where orientation about the agent gets converted into action on the agent.
In this configuration, a robust Decide phase is characterized by three distinct markers: (1) selecting from a set of options that Orient has already contextualized; (2) carrying an explicit hypothesis about what the decision will accomplish, framed in terms of the value it delivers, so the decision becomes testable and measurable (more on that when we discuss OSSO loop); (3) leaving a trace of the actual decision, thus becoming a node in the context graph, with why-links to the orientation that produced it and outcome-links waiting to be attached as evidence arrives, so that the next time a similar situation surfaces, this decision is "queryable" as precedent.
Act
The Act phase translates insights from Orient and choices from Decide into actual agent modifications. These actions are multifaceted, ranging from tightening guardrails and refining tool descriptions to generating retraining signals from decision traces. They may involve routing adjustments, capability expansions, policy updates, or structural enhancements to the evaluation test suite.
The Act phase ultimately tests the team's orientation. Frequent surprises, where metrics improve, but user experience degrades, signal that Orient is based on a drifted theory of agent behavior. In such cases, teams should reinvest in Orient to rebuild an accurate understanding of reality.
Finally, it is worth explicitly highlighting a potential application you may have already considered: utilizing the OODA loop within root cause analysis. By framing the incident as the "opponent" in a conflict scenario, this loop becomes a strategic tool for tracking and optimizing the mean duration between the onset of an issue and the full restoration of services. Some detailed performance indicators for this process are outlined below:
Key Metric | Measurement Focus | Strategic Value |
|---|---|---|
Mean Time to Detect (MTTD) | Elapsed time from the start of the incident to its identification. | Evaluates the speed of organizational awareness. |
Mean Time to Acknowledge (MTTA) | Duration between receiving an alert and an owner assuming responsibility. | Assesses response readiness and accountability. |
Mean Time to Investigate (MTTI) | Time taken from ownership to the commencement of active diagnosis. | Indicates how efficiently teams transition to analysis. |
Mean Time to Root Cause (MTTRC) | Time spanning from incident detection to a verified root cause. | Serves as the primary velocity metric for RCA efficacy. |
Mean Time to Fix (MTTF) | Time between identifying the root cause and deploying a resolution. | Distinguishes diagnostic speed from technical execution speed. |
Ultimately, this highlights that every OODA cycle must yield progress across two dimensions: (1) enhancing the AI system’s functional performance and (2) strengthening the team’s proficiency in managing unpredictable scenarios.
The Observe - Stabilize - Standardize - Optimize (OSSO) Loop
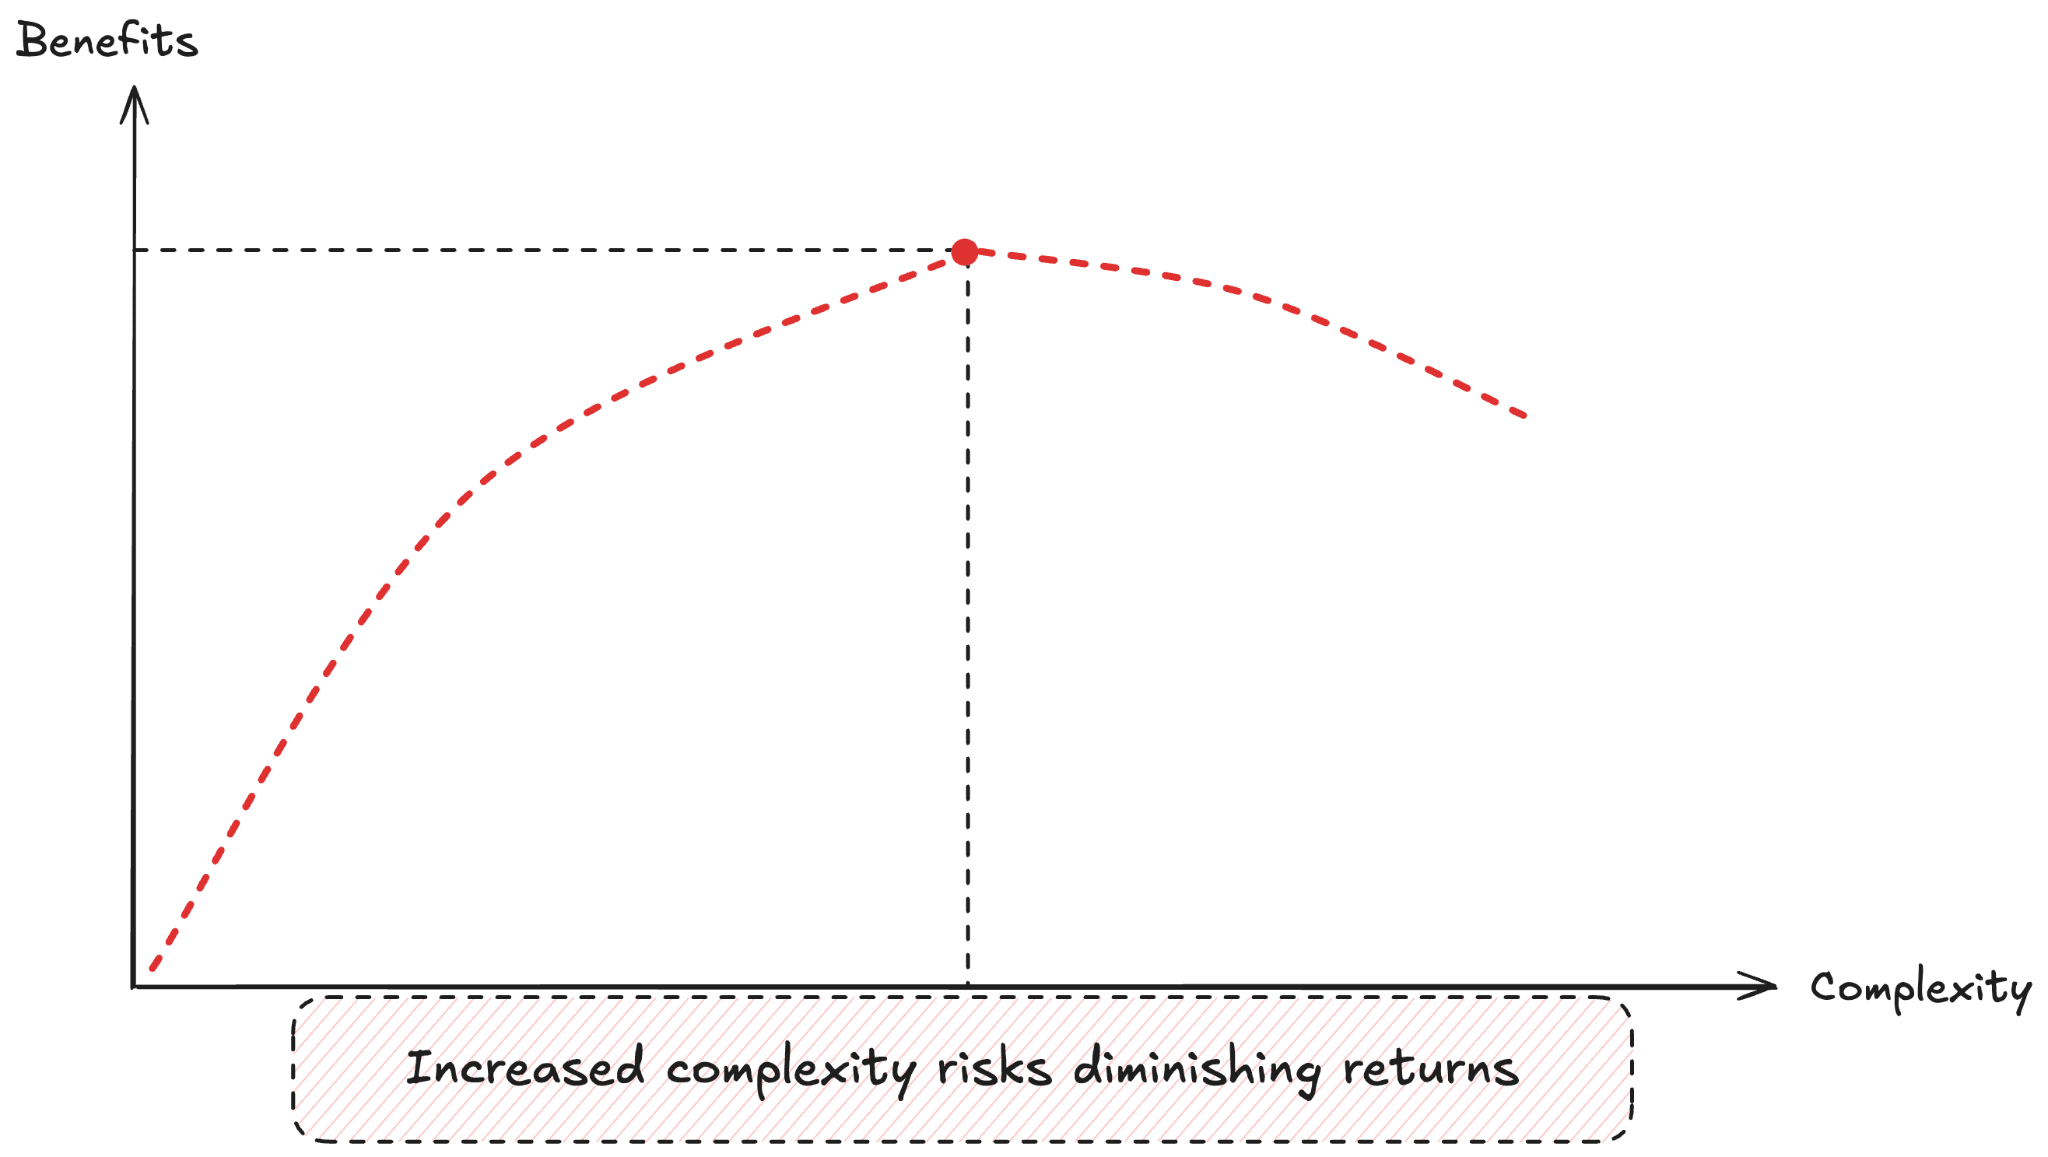
As AI systems’ complexity increases, so does the risk of diminishing returns because, at scale, unit economics can become unpredictable. This is the core problem: in agentic systems, cost is a runtime variable, rather than a predefined constant.
The unit economics must account for this variability, or organizations will find themselves unable to price their products, forecast their expenses and revenues, or determine whether a workflow is financially viable.
And this is exactly what the second loop (OSSO) is addressing because it’s a method for achieving sustainable unit economics in AI systems. It provides a structured path from performance-work to value-optimization work, with cost efficiency at the center of every decision.
Let’s take a scenario that plays out in scaleups and enterprises everywhere, a frantic, costly cycle of good intentions gone awry: the operational team, desperate to trim the mounting $50k/month LLM bill, initiated a rapid-fire cost-optimization sprint. With a 75% margin on $200k in monthly revenue, trending downwards, the perceived threat was immediate, but the underlying context was ignored: this cost was integral to the product's value proposition.
The mandate was set: "Aggressive caching and model-tier downgrades immediately." The initial report was a success: costs were down to $40k. However, the subsequent revenue report revealed a disturbing trend: a $50k drop, bringing monthly revenue to $150k. The system-wide degradation, masked by the reduced inference costs, was beginning to impact the top line. The product quality metrics cratered. Customer churn accelerated, forcing revenue even lower to $125k. The cost-saving measures had directly compromised the core features customers were paying for. The initiative was declared a catastrophic failure. All changes were rolled back.
Why did it fail?
Because the team optimized in the dark, cutting costs without any real understanding of the downstream effect on revenue. Their misguided, myopic focus was solely on cost reduction, when the intelligent, strategic objective should have been value maximization.
This kicked off what I call the leadership’s chaos cycle: high costs hit their ears, panic ensued, leading to random, desperate optimizations. Naturally, this degraded the product quality, which meant revenue was lost, resulting in even worse margins. This, of course, can lead to more panic and a fresh round of worse decisions.
The OSSO loop can guide major decisions across the entire tech stack by painting a complete picture of the (connected) unit economics involved. It is a four-phase methodology for systematic unit economics management, operating on the core principle that cost optimization without revenue context is hazardous, and its ultimate goal is to help teams achieve value-based growth:
Observe - Measure unit economics per customer/feature/etc.
Stabilize - Identify & prevent unprofitable customers/features/etc.
Standardize - Create repeatable, sustainable unit economics
Optimize - Ongoing value maximization per dollar, not just minimizing cost
Observe
The OSSO loop prioritizes the fundamental unit of economic value and its temporal evolution. Consequently, our focus shifts away from high-level metrics and averages toward granularity. This granular perspective is crucial for identifying and optimizing local causes. Knowing that you spent $50,000 last month on AI infrastructure tells you almost nothing actionable. Knowing that a specific feature consumed 45% of that cost while generating only 12% of your revenue tells you exactly where to act.
The primary OODA loop is collapsed into the Observe phase of the OSSO loop. This architectural choice ensures that the initial stage of the process provides comprehensive transparency across every economic unit, spanning performance, expenditure, and income, at every granular level, including customers, applications, and individual features.
It begins with the Definition step, where teams establish an economic value hierarchy and select primary units of measurement like customers, apps, or features. This is followed by Instrumentation, utilizing telemetry to tag traces with relevant context and integrating diverse data streams from billing and revenue platforms. Finally, the Attribution step involves collecting baseline data to identify value drivers and create dashboards that reveal whether specific units are creating or destroying value (sample cost attribution matrix below).
COST ATTRIBUTION MATRIX | ||||||
LLM | Tools | Database | Memory | Compute | Total | |
Product #1 | $3,500 | $200 | $50 | $20 | $100 | $3,870 |
Product #2 | $2,800 | $3,200 | $100 | $50 | $200 | $6,350 |
Product #3 | $1,170 | $335 | $30 | $150 | $45 | $1,730 |
Total | $7,470 | $3,735 | $180 | $220 | $345 | $11,950 |
When all three steps are done well, Observe delivers something rare: the ability to look at any customer, any feature, or any trace and know, within seconds, whether it is creating or destroying value (and by how much). While high-level metrics remain indispensable for executive leadership, engineering AI value requires a granular approach. This level of detail is vital for effective unit economics management, as it allows teams to pinpoint and resolve the specific root causes of value leakage. By correlating these attribution matrices with revenue and margin, teams can gain valuable insights into customer value being delivered. This analysis helps identify:
High Cost | Low Cost | |
High Revenue | Stable Assets | Cash Cows |
Low Revenue | Problem Areas | Alerts |
Finally, unit economics graphs offer a complementary way of navigating unit economics at various levels, providing a detailed view of each node (see sample graph below). Rather than presenting economics as a flat table or a set of disconnected dashboards, a graph structure mirrors the way value actually flows through an AI system: from a single atomic request, up through features and sessions, to the customer, and ultimately to the business as a whole.
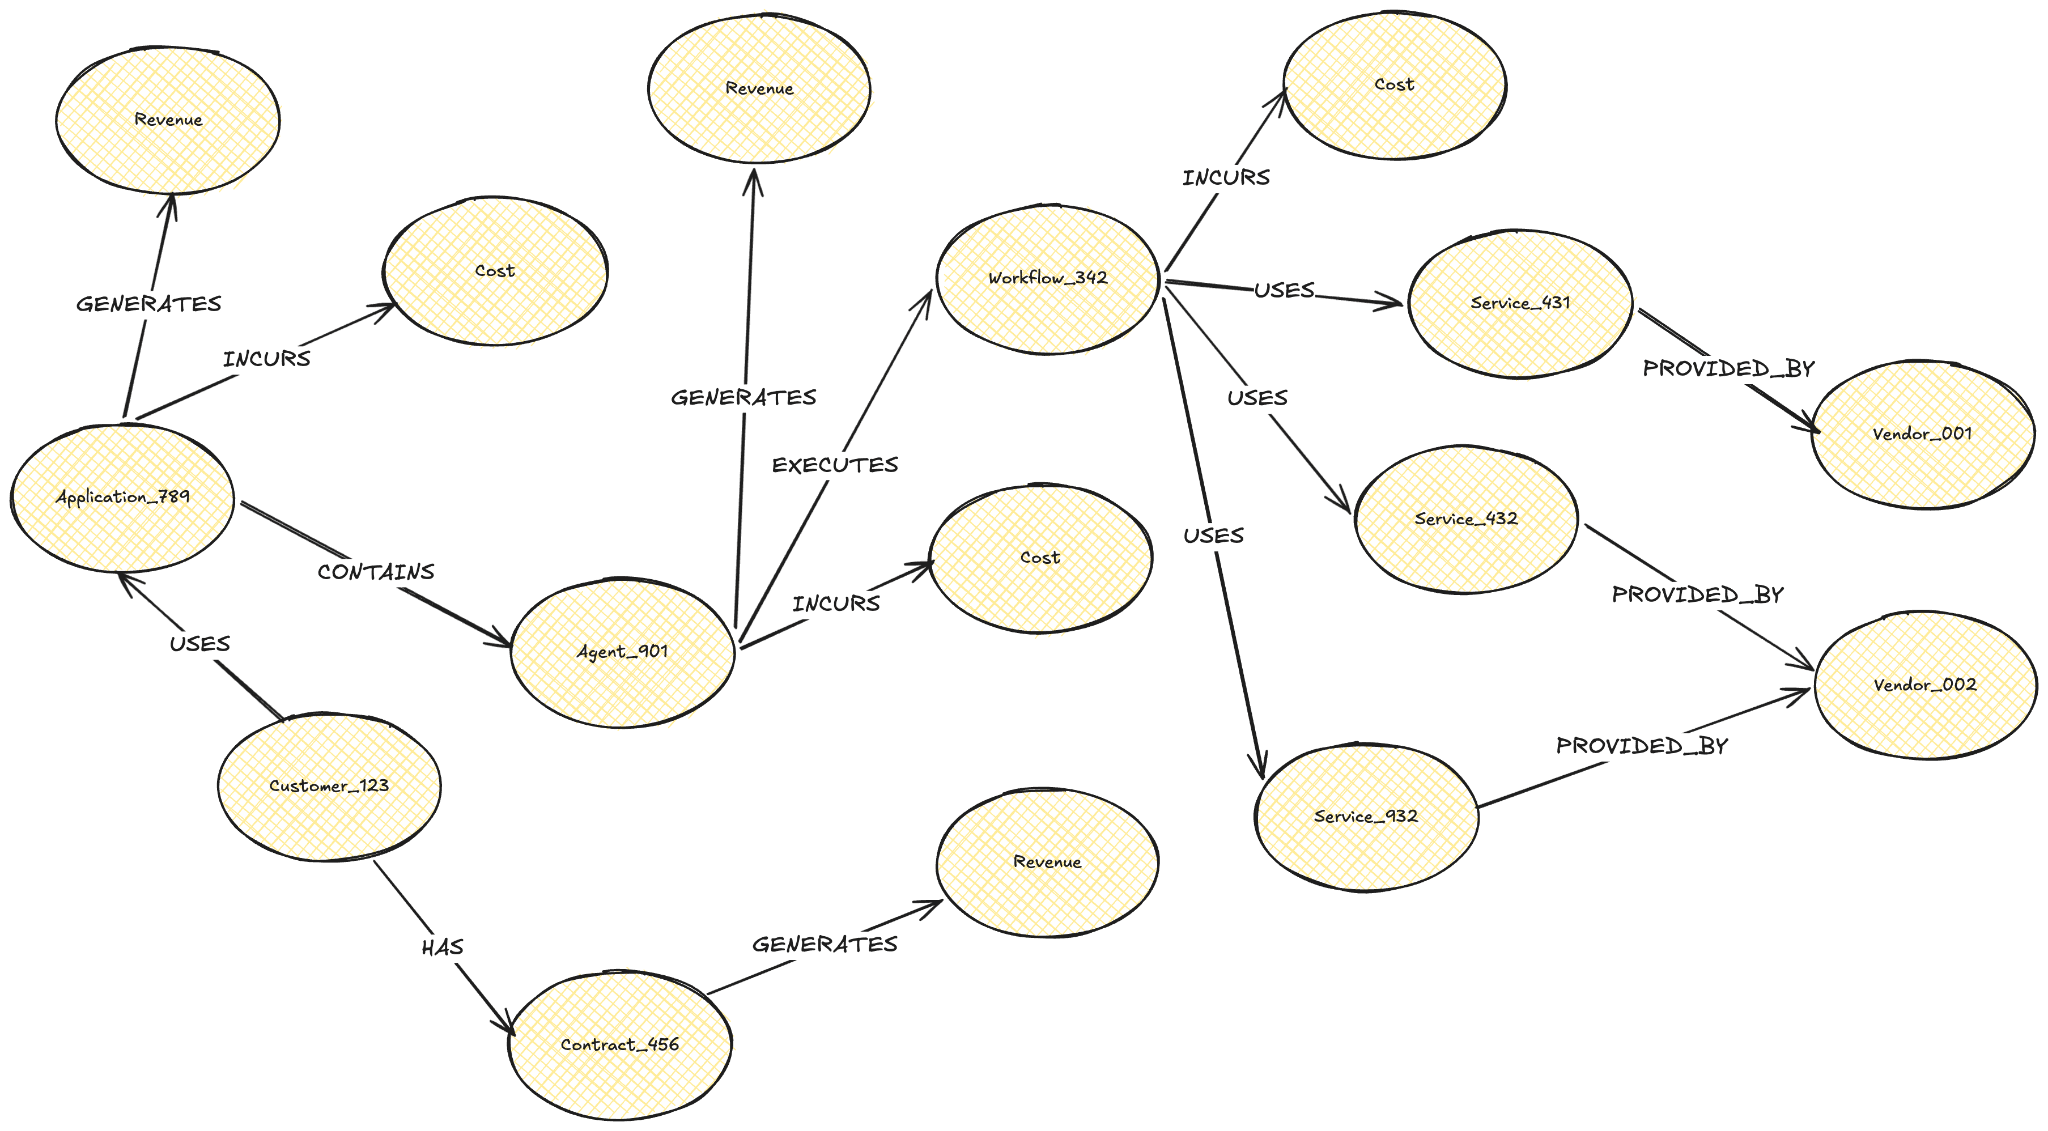
Each node in the graph represents a distinct economic unit, carrying its own cost, revenue, and margin. Each edge represents a relationship: how requests compose into sessions, how sessions aggregate into customer behavior, how customers cluster into cohorts. This connected structure is what makes the graph format uniquely powerful because it shows you why something costs what it costs, by tracing the economic contribution of every component along the path.
This matters especially in agentic systems, where the cost of a single workflow is non-deterministic. A multi-agent travel planning workflow, for instance, might execute different paths depending on the models selected, the tools invoked, and the success rate of third-party integrations.
Stabilize
Observe established visibility, Stabilize establishes control, but not through full automation. The instinct after seeing a profitability dashboard for the first time is to immediately wire everything into automated rules. That instinct should be resisted because automation built on untested assumptions about where problems actually occur, how often they recur, and what interventions genuinely resolve them tends to produce two failure modes: (1) over-triggering that degrades user experience for customers who were never actually a problem, and (2) under-triggering that misses the failure modes that matter because the thresholds were calibrated against theory rather than operational experience.
Stabilize is primarily a manual phase.
Its purpose is to take the baseline economics context graph produced by Observe and use that to identify real patterns that can be evaluated through human judgment before any response is systematized.
Alerts fire, people respond, decisions get made, and patterns emerge. Over time, the team accumulates (and documents) enough operational experience to know which problems are predictable enough, frequent enough, and well-understood enough to be worth designing a guardrail around. Those guardrails are then defined and deployed one at a time, not as a bulk release, but incrementally, each one earning its place through demonstrated usefulness in production.
Stabilize's manual triage is essential because human judgment can trace a visible symptom back to its cross-level root cause, which premature automation cannot. For example, an image generation request costs $3.7, but no request-level alert fires. The feature quietly hits a -54% contribution margin, making heavy users and their acquisition cohort (free-tier) unprofitable with poor lifetime value. The time-level trend is only visible in the monthly dashboard after weeks of compounding damage. Manual triage catches this chain early when a human notices the feature-level margin anomaly, traces it to request-level costs, and decides on a response. This experience then guides the decision to build an automated control, its threshold, and its effective response.
The boundary between Stabilize and Optimize is straightforward: if it requires a human decision, it belongs in Stabilize. If it can be safely automated because the pattern is fully understood and the response is well-validated, thus Standardized, it can move to Optimize.
Standardize
Standardize exists to prevent the knowledge from the previous Stabilize phase from staying locked inside the individuals who accumulated it. Left undocumented, the patterns learned during Stabilize degrade the moment someone changes teams, a new engineer joins, or a product decision is made without the benefit of what the economics team already knows.
Standardize is the phase where operational experience becomes best practice. Its job is to codify what the organization has already learned into a form that any team member can apply consistently, without needing to reconstruct the reasoning from scratch. A new feature should not require its team to rediscover that image generation costs $3.7 per request and has historically destroyed margins for free-tier cohorts.
The objective of this step is to transform the operational experience accumulated during Stabilize into documented, org-wide unit economics practices, embedded in the processes by which features are built, priced, and reviewed, so that economic knowledge is embedded in the decision and does not depend on individual memory.
Thus, Standardize is organized around three sequential activities. Their duration depends on the size of the organization, the number of teams that need to adopt the standards, and the complexity of the economic patterns that emerged from Stabilize:
Document, which extracts durable knowledge into reference materials;
Enable, which embeds these standards into decision-making processes to ensure compliance;
Iterate, which keeps the standards current through continuous review and a lightweight revision process.
The primary deliverable of Standardize is a living value context graph that encodes everything the organization has learned about its unit economics. By leveraging this graph, teams can utilize its insights within the Optimize phase, eliminating the necessity for teams to re-evaluate the underlying logic.
Optimize
While Standardize preserves the organization's operational knowledge, that knowledge becomes executable in Optimize. This is the defining transition of the OSSO loop: the move from human-driven responses to system-driven responses for mature failure modes where the underlying logic is well-established. To appreciate why this transition matters, it is worth tracing the arc across all four phases.
In Observe, the team gained visibility, and it could see what was happening, but could not act on it systematically. In Stabilize, the organization gained control: alerts fired, humans investigated, and manual interventions were applied, building up a triage log of recurring patterns, root causes, and effective responses. In Standardize, that hard-won operational experience was codified into a value context graph. Optimize overcomes the need for human decision-making in response to marginal problems.
In Optimize, the human role shifts from responding to individual alerts to designing, deploying, and supervising automated workflows and to handling the genuinely novel problems that automation is not yet equipped to address.
This distinction is critical and worth stating as a rule: an intervention can be automated in Optimize if, and only if, it satisfies three conditions drawn from the prior phases:
The pattern must have been observed repeatedly during Stabilize triage. Not once, not theoretically, but frequently enough that its recurrence is predictable.
The root cause must be consistent: the same underlying driver each time, not a symptom with multiple possible explanations.
The manual response must have been validated as effective: the triage log must show that the same intervention resolved the problem reliably, without requiring contextual judgment.
If any of these three conditions is not met, the intervention belongs in Stabilize (manual triage), not in Optimize (automated response).
Optimize is also the only phase that never ends. Observe, Stabilize, and Standardize each produce a defined set of deliverables and transition into the next phase. Optimize, by contrast, is a continuous cycle: identify the highest-value automation opportunity, implement and deploy it, measure the result against both cost and revenue impact, feed the learning back into the standards, and repeat. The compounding nature of this cycle, where each automated optimization frees human attention for the next, is what distinguishes Optimize from the ad hoc cost-cutting that the OSSO loop was designed to replace.
The goal of this stage is to drive maximum value by transforming proven, repeatable optimization workflows into autonomous systems. By automating these patterns, the system can operate independently while reserving human oversight for complex, high-judgment challenges that fall outside established norms. Ultimately, this approach represents the true essence of engineering AI value.
Some final thoughts
I’d like to briefly touch upon the topic of productivity in this new AI reality we all live in, because it closely connects to AI value creation. If we’re guided by the ratio of output to input to measure productivity, and then we look at the rate of its growth, we’re probably at an all-time high across the board.
However, can we conceptually measure AI productivity today the same way Adam Smith did in his 1776 book, “The Wealth of Nations”, famously using a pin factory to describe how specializing labor soars output?
To take an example, [...], the trade of the pin-maker; a workman [...] could scarce, perhaps, with his utmost industry, make one pin in a day, and certainly could not make twenty. But in the way in which this business is now carried on, not only the whole work is a peculiar trade, but it is divided into several branches, of which the greater part are likewise peculiar trades. One man draws out the wire, another straights it, a third cuts it, a fourth points it, a fifth grinds it at the top for receiving, the head; to make the head requires two or three distinct operations; to put it on is a peculiar business, to whiten the pins is another; it is even a trade by itself to put them into the paper; and the important business of making a pin is, in this manner, divided into about eighteen distinct operations, which, in some manufactories, are all performed by distinct hands, though in others the same man will sometimes perform two or three of them.
[...] Those persons, therefore, could make among them upwards of forty-eight thousand pins in a day. Each person, therefore, making a tenth part of forty-eight thousand pins, might be considered as making four thousand eight hundred pins in a day.
How relevant is this classical productivity model in our increasingly AI-saturated environment? Consider the output-to-input ratio of two different teams: one consumes 1M tokens to generate 1M lines of code, resulting in zero revenue, while another achieves the same output but generates $1M in income.
To truly create value, we need to stop misleading ourselves with the emptiness of output metrics, which are like "tokenmaxxing" or counting pins in modern times. Instead, shouldn't we pivot our focus toward economic productivity? If we do that, it is my belief that engineering AI value becomes less about technology and more about the rigorous alignment of system performance with demonstrable economic value.
That’s what the Framework for Engineering Agentic Value proposes in a nutshell. It combines two loops: OODA to improve agentic performance through better observation, orientation, decision-making, and action; and OSSO to make unit economics visible, stable, standardized, and continuously optimized. Together, they help teams move beyond ad hoc cost-cutting or vague productivity claims and toward systematic value creation.
The core idea is simple: agentic systems should not be judged by how much they produce, how many tokens they consume, or how “AI-native” a team appears to be. They should be judged by whether they deliver measurable performance at a sustainable cost. In other words, engineering AI value means aligning what the system does with what the business and customer actually gain.
If you’re building, operating, or scaling agentic systems, try applying the framework to one production workflow, one cohort, or one feature. If it helps you find even one expensive anti-pattern, one unstable customer segment, or one automation opportunity that improves both performance and margin, you’re already engineering AI value instead of just measuring AI activity.
TAGS:
tokenmaxxing, AI, agentic, engineering, token, Claudeonomics